In this post we'll test three different cyclically-adjusted valuation measures: CAPE (earnings), CAPD (dividends) and CAPB (book value). CAPE is calculated like the P/E ratio, but by dividing the current real price with the last ten year's average inflation-adjusted earnings. CAPD uses dividends instead of earnings, and CAPB uses book value. We'll test the optimal measurement (i.e. forward-looking return) period and formation period for all three valuation measures by calculating correlations with the future returns.
Typically CAPE, also known as P/E10, is calculated by using a 10-year formation period. The maximum time period for both the formation period and measurement period we'll use is 30, which means that the performance of for example P/E1-P/E30 will be tested by looking forward 1-30 years.
Typically CAPE, also known as P/E10, is calculated by using a 10-year formation period. The maximum time period for both the formation period and measurement period we'll use is 30, which means that the performance of for example P/E1-P/E30 will be tested by looking forward 1-30 years.
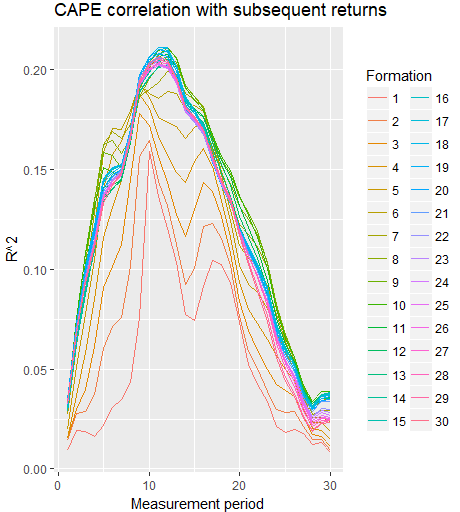
We'll use Shiller and Goyal data from the US, which both begin from the year 1871. We'll plot the measurement period (in years) on the x-axis and r-squared on the y axis, and we'll make a distinct line for each of the formation periods.
As you can see from the plot above, a measurement period of about ten years, or maybe a little more, has worked the best for CAPE. As expected, valuation measures don't do a good job explaining short-term returns. However, this also applies to long-term returns, which gives the lines a bell-curved shape. The lines with shorter formation periods are lower than the rest, which means that short-term valuation measures such as normal trailing twelve-month P/E also don't work as well as the long-term valuation measures.
For CAPD, the correlation turns positive at long measurement periods, which is rather unwanted. The better performance of the long-term and the worse performance of the short-term valuation measures are more apparent with CAPD.
For CAPB, longer measurement periods of about twenty years seem to work the best. The r-squared is much larger than with CAPE or CAPD. Even the worst formation periods seem to work better in explaining future returns than the CAPE with the best formation period. This is consistent with Keimling's research (pdf, page 16), which suggests that normal P/B is almost as strong in predicting future returns as CAPE. The plot above shows that the cyclically-adjusted P/B is even stronger than CAPE in predicting future returns.
The reason why the r-squared of the CAPE is lower than what is often quoted is because of the long time period of the data. As you can see from the plot below, the rolling 10-year correlation of CAPE and subsequent returns has been rising over time.
Another way of viewing these correlations is bringing them into Excel and color coding them. Notice that we are now using simple correlations instead of the r-squared. The x-axis tells the formation period of the valuation measure, and y-axis tells the measurement period i.e. how long into the future the valuation measure is used to predict.
The 10-year CAPE has surprisingly high explanatory power even for forecasting 1-year periods. The explanatory power starts declining noticeably from P/E8 to the left and P/E14 to the right.
For CAPD, the correlations are weaker, but the shape is about the same.
CAPB has the strongest correlations with future returns, but the shape is way different. Interestingly the strongest explanatory power regarding future returns comes from 22-24-year P/B and for a measurement period of 5-15 years.
This post was partly inspired by the O’Shaughnessy Quarterly Investor Letter Q4 2018.
Be sure to follow me on Twitter for updates about new blog posts!
The R code used in the analysis can be found here.


Be aware of correlation ...
ReplyDeleteThe $/Yen Follows a Stochastic Process ... NOT!
https://www.linkedin.com/pulse/yen-fx-rate-follows-stochastic-process-brian-k-lee-mba-prm-cfa/
Brian K, Lee, MBA, PRM, CFA